Chapter 6. Working with data: lists
In the previous chapter, we have seen that we can write programs that handle quite large amounts of data. In the example we have programmed, the data was text, and the individual data items were characters, which were held in a string. Almost all programs, in fact, work with collections of data, often very large collections, and the ability to process large collections of data is one of the core characteristics of computers.
In this chapter, we will investigate how we can work with other types of data – data that is not text. Once you start thinking of applications on a computer, you will notice that almost all of them have at their core the processing of collections of data: word processors handle collections of words and sentences; search engines process collections of webpages; social media apps handle collections of posts; games animate collections of game items; weather forecast programs process collections of environmental readings, and so on.
Think about the programs you use most often on your phone or your computer: there are very few programs that are not based, in some form, on the processing of collections of data.
In previous chapters, we have seen variables, which allow us to store data. We have also seen that variables can store data of different types – such as int, float, or str. However, each variable stores only one value. What if we want to work with hundreds, or thousands, of data items?
If would not be practical to use a thousand different variables. Instead, Python offers collection types – types of data that can store a whole collection of data items in a single object.
The most common of the collection types in Python are lists, dictionaries, tuples and sets. We will have to become familiar with all of them. We will start – in this chapter – by looking at lists.
6.1. The temperature dataset
We will investigate and practice working with a list using the temperature project from the Chapter06 folder of the book projects. This project provides a dataset of the average daily temperature (in degrees Celsius) in London, UK, for each day in 2025.
Let us start by looking at this data.
Exercise 6.1 Open the
temperature project from Chapter06 of the book projects. You will see that it reads a file called "/data/london-temperature-2025.txt" into a variable called data. Print out the data variable. What do you see?
With the previous exercise, you will have seen that data contains a long list of numbers, which are printed separated by commas, and enclosed in square brackets. This tell us that data is a list: Lists in Python are written in square brackets, and their elements are separated by commas. Each value in this list is the average temperature of one day, starting at 1st January.
Exercise 6.2 Add the following lines to your program:

What do you see? Try this with values other than 1, 2, 3 – also use strings and floating point numbers in your experiments. Can you tell from the output what the type of the element is?
In Python, the square brackets [ ] create a list, and we can write the list elements between the brackets. So the expression [1, 2, 3] created a list with three elements in it, and printing out the list prints the elements to the console.
 Python provides a list type, which can store a list of items. Lists are defined using square brackets and values separated by commas:
 [1, 2, 3].
If we are unsure about the type of one of our variables, we can inspect it in our code. The type() function tells us the type of data held in a variable. For example,

will print out the type of the variable numbers.
Exercise 6.3 Print out the type of the numbers variable. What is it?
Exercise 6.4 What is the type of 5, the type of 5.0 and the type of "5.0"?
We can find out the type of a data item using the built-in type() function.
6.2. Fundamentals of lists
6.2.1. Accessing elements
Once we have a list, we can easily access individual list elements using square brackets and an index after the list name. For example

accesses the element number 1 from the list. Let’s try this out.
Exercise 6.5 Remove your numbers list from your program again if it is still there, and go back to working with the temperature data. Print out element number 1 from that list using the following statement:

Compare this to the elements you see when you printed the whole list. Can you see the individual value you printed in the list? Which element did you print?
Exercise 6.6 Print out the fourth element of the list. Then print out the first element.
We can access individual elements in a list by providing an index in square brackets, in the form list[index].
6.2.2. Index numbering
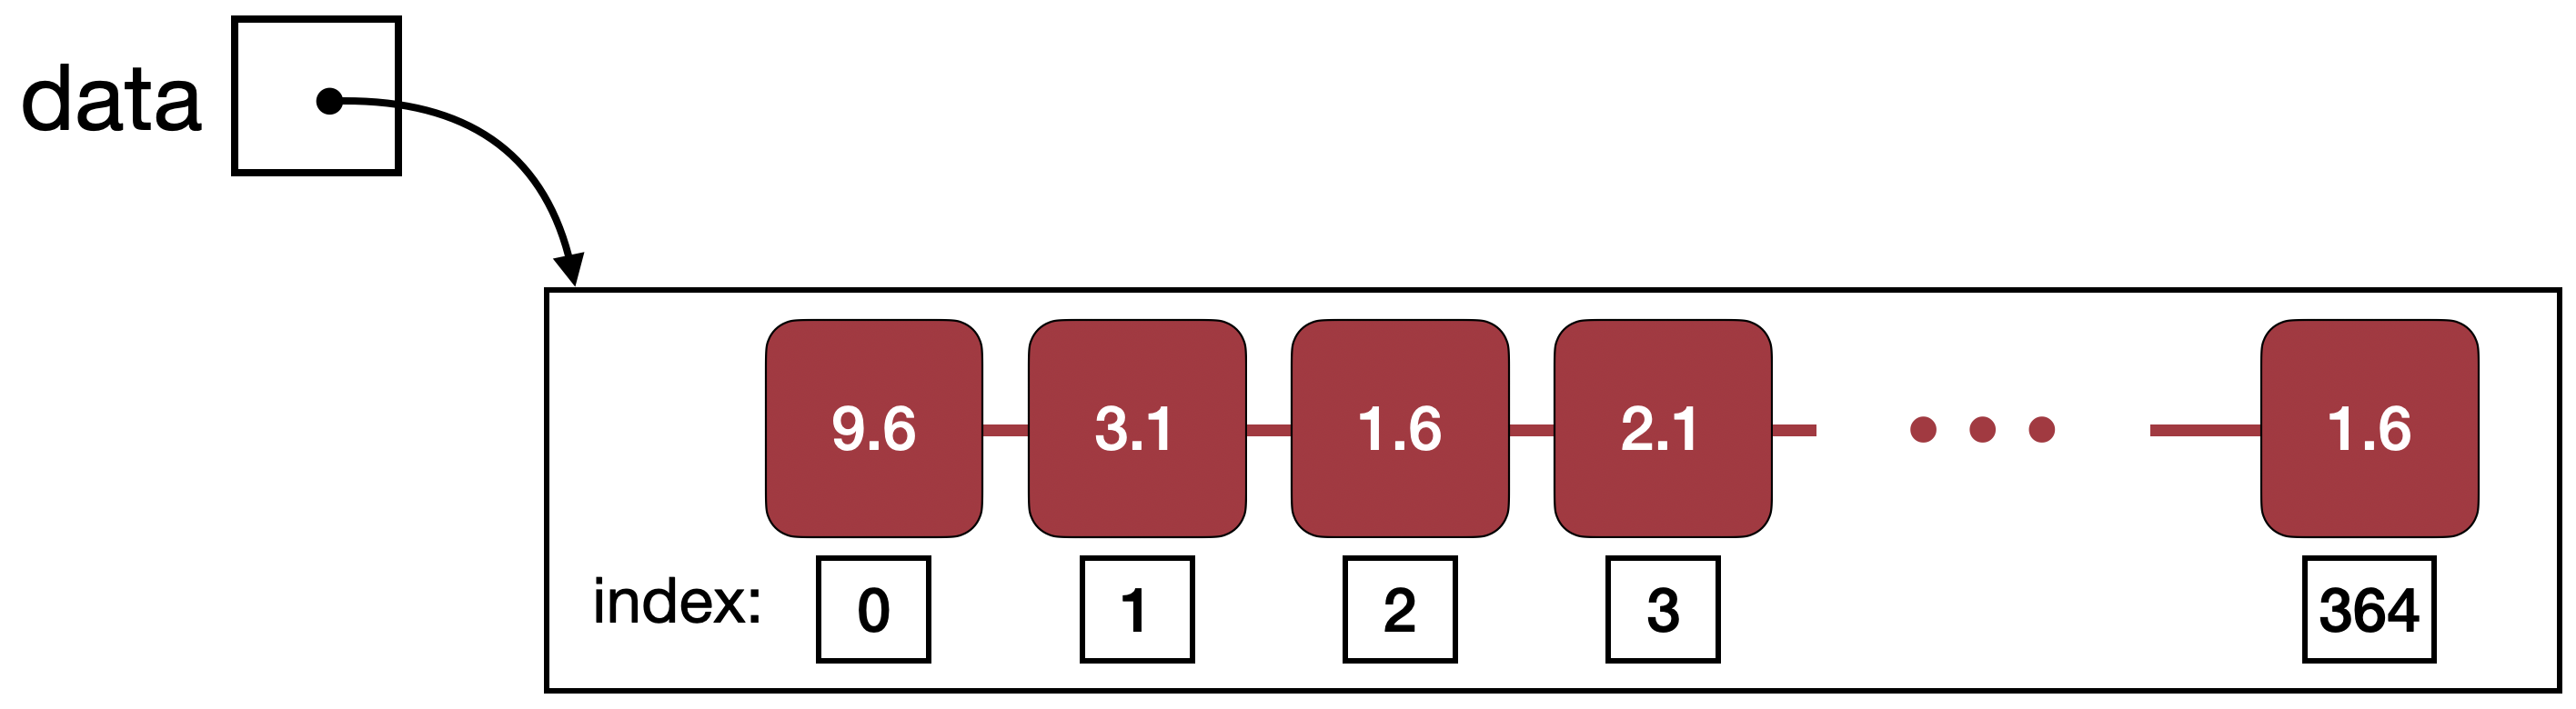
When you did the previous exercises, you will have see that printing data[1] does not print the first element of the list, but the second. This is because element numbering in lists starts with 0. We call the position of a list element its index, and Figure 6.1 shows a list with the assigned index numbers. In this diagram, we can see that we need to print out the element at index zero if we want to see the first element.
Exercise 6.7 In a list with 32 elements, what is the index number of the last element?
Exercise 6.8 In a list of length n, what is the index number of the last element?
Index numbers in lists start with index 0.
6.2.3. Element types
We can now start writing code to do some analysis of the temperature data. We might, for example, like to know what the lowest temperature of the year was, or the average temperature in July.
Once we start doing this, we will notice a small problem. To illustrate this problem, let us start by doing a very simple exercise.
Exercise 6.9 Add the first and the second element of the list together and print out the result. What do you see? Is this what you expected?
If you have done this exercise, and if you have written data[0] + data[1] to add the two values, you will have noticed that the output is not what we would expect.
The two first values in the list are 9.6 and 3.1, so we would expect to see a result of 12.7. This is not what we saw. So what is going on here?
The reason for the unexpected result is that the elements in the list are not numbers, but strings. So the first element is not the number 9.6, but the string "9.6". We get a clue to this fact from the output: if you pay close attention, you notice that the values in the printed-out list are all enclosed in quotes: '9.6' instead of 9.6. Remember that strings can be written with double quotes or single quotes – so this tells us that the elements are strings.
The + operator, which is performing addition when the operands are numbers, actually performs string concatenation if the operands are strings. String concatenation just glues two strings together. For example, the result of
"Cat" + "Fish"
is
"CatFish"
(Note that Python does not automatically add a space when concatenating strings.)
The reason that our data is represented in strings is that it was stored in a textfile. The content of a textfile, when we read it, is always delivered to us as strings when we read a file. In our case, we know that the file content is a set of numbers, but to get it into a number format in our program, we first have to convert the strings back into numbers.
String concatenation joins two strings together into a single string. It is written with a + sign: string1 + string2.
Exercise 6.10 The type() function which we have seen above can also be used to check the type of the individual list elements. Try this by printing the type of the first element in the list. What is it?
6.2.4. Type conversion
When we see the values, 5, 5.0 or "5", we tend to read them all as "five". In Python, these values represent an int, a float and a string, respectively, and they are internally stored in completely different ways.
We have also seen that performing operations on these different types can do entirely different things. For example, 5+5 is 10, but "5"+"5" is "55". On the other hand, "5"-"5" will produce an error (since the minus operator is not defined for strings), but this is a perfectly valid thing to do with ints or floats.
In short: the fact is that the number 5 is not the same as the string "5".
We can, however, convert values of one type to another type. We do this by using functions that have the same name as the type we wish to convert to. For example:

In this example, the str type is converted to a float, and the type of number will be float. Equally, we can use the functions int(n) and str(n) to convert values to the int or str types. We have to take care, though: if we try to convert a string to a number, and the string does not actually contain a number, we will get an error.
Values can be converted from one type to another by using built-in type conversion functions. The most commonly used conversion functions are int(n), float(n) and str(n).
Exercise 6.11 Write some code to convert the string " 001.00300" to a float and print the result. What is the value?
Exercise 6.12 What happens when you convert 3 to a float and print it? What happens when you convert 3.8 to an int? What are the resulting values?
6.2.5. Building a new list
The last two sections serve to illustrate just one important insight: to use our list of temperature data properly, we need to convert our list of strings to a list of floats.
We do this by building a new list. We iterate (loop) over the original list, read every element in turn, convert it to a float, and add it to our new list of floats. The code to do this looks like this:
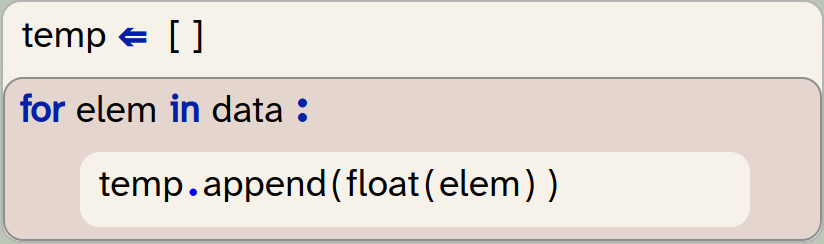
In this code snipped we do several things:
-
We create a new, empty list by using the square brackets:
[ ]. This list will initially have no elements in it, but it is still a valid list. We assign it to the variabletemp(short for temperature). -
We iterate through the
datalist. This take each list element in turn, convert it to a float, and append it to thetemplist.
We can see that list objects have a method called append(n). This method adds its parameter to the end of the list it is called on.
At the end of this, we expect the temp list to have the same number of elements as the data list, but holding floats instead of strings. Check this by checking the length of each list. Remember, we have seen in the previous chapter that we can use the len(list) function to get the length of a list.
Exercise 6.13 Implement the conversion of the list of strings to a list of floats, as shown above. To test whether this was successful, print out the temp list. Can you tell whether the elements are now numbers?
Exercise 6.14 Print out the length of both lists. Are they the same? How many elements are in the list?
Exercise 6.15 If you prefer to work with degrees Fahrenheit, rather than Celsius, you can do the following: Convert the temperature list to Fahrenheit. Do this by building a new list, where each element is calculated from the existing list. The formula to calculate degrees in Fahrenheit (F) from Celsius (C) is F = (C × 9/5) + 32.
We can create an empty list by writing just a pair of square brackets: [ ].
The list method append(n) adds an element to the end of the list it is called on. It is called in the format list.append(elem).
 Precision of decimal numbers: If you look carefully at the printed list of numbers, you will see that some elements have unexpected values. For example, we see
 9.300000000000001 where we would expect 9.3, or we see 8.69999999999999 instead of 8.7.
This is caused by the way floating point numbers are stored in computers: Decimal values in computers all have limited precision. That means that they cannot store an arbitrary number of decimal places – they are all rounded at some point. And because they are internally stored in a binary format – different to the decimal format we write – what appears as a simple number for us, 9.3, is sometimes "rounded" to a surprising binary value internally.
The lesson to take away from this is: working with floating point numbers is always imprecise, and small rounding errors creep in in all floating point calculations. Often, however, the result is precise enough for what we need.
We can round the value before we print it out to remove extra decimal places.
6.3. Operations on lists
Now that we have a list of numbers, rather than a list of strings, we can start looking at values in a more meaningful way.
6.3.1. Finding elements: hottest temperature of the year
The first thing we might ask about the London temperatures is: How hot was the hottest day of the year? How cold was the coldest?
We can find the answer to both of these questions quite easily now: Python has built-in min(list) and max(list) functions, which find the minimum and maximum values in a list.
Exercise 6.16 Print out the temperature of the coldest day of the year. Print out the temperature of the hottest day of the year. Make sure you print some text as well to state what the values are.
Note that the data is the average temperature for each day, with the first data point the average for the 1st of January, and the last the average for 31st of December. So the minimum we see here is not the coldest temperature recorded in the year, but the coldest daily average.
The min(list) and max(list) functions can be used to find the minimum or maximum value in a list.
6.3.2. Finding the index of an element: When was the hottest day?
We can now see what the minimum and maximum temperatures were – but on which day did they happen?
To answer this question, we need to know where in our list the maximum value was found. We can find this out using the index method. For example

will return the index of the value 13.6 in the list temp. (We have to be careful with this: If the value we are searching for is not found in the list at all, then this will be an error. So we should call the index method only if we know the element exists.)
We can now find the index of the hottest day by writing

This statement first finds the maximum value, and then finds the index of that value.
Exercise 6.17 Write code to find the index number of the hottest and coldest days. Print out the results. Make sure to print your output with information what the number means.
Currently, we only get the index of the day in our list, rather than a properly formatted date. The index identifies the day (we know that index 0 is the 1st of January, and index 364 is the 31st of December, and we could count out the days inbetween), but it is not a convenient format.
For now, we will leave it as it is – just printing out the day number is a decent start. We will look a little later, further down in this chapter, at how to convert this to a date.
Another limitation worth mentioning is that the index method only finds the first occurrence of a value in a list. So if the maximum temperature was reached twice, at exactly the same value, we will find only the first of these days.
The list.index(n) method can be used to find the index of the first occurrence of element n in the list. The element must exist in the list when this is called.
Functions versus methods: Python makes use of both functions and methods in the functionality it provides for lists. This can be a bit confusing.
Functions are called in the format
function_name(list)
while methods are called in the format
list.method_name(param)
For list functions, we pass the list into the function as a parameter, while for list methods, the list is named first, in front of the dot.
The reason is partially historic, and partially pragmatic. Functions are typically used when the operation can also be applied to types other than lists. len(n), for example, can be applied equally to a list and to a string. Methods, on the other hand, belong to the list type.
The most important list functions are:
len(list), min(list), max(list), sum(list), sorted(list)
The most important methods are:
list.append(), list.clear(), list.copy(), list.count(), list.extend(), list.index(), list.pop(), list.remove(), list.reverse(), list.sort()
You can find a description of these methods in Appendix E: Built-in functions.
6.3.3. Slicing: Looking at individual months
The next thing we may want to do is to analyse specific months.
Taking a specific sub-list out of an original list is called slicing: We are taking a slice out of a list. Slices are written in square brackets, with the beginning and end index specified. For example

creates a new list with the first 31 values copied from data and assigns it to the variable jan. If we want a slice from the start or to the end of a list, we can just leave off the lower or upper bound. For example

does the same thing: it creates a slice from the start of the list to index 31. If we leave off the end index, then we get a list with all values from the start index to the end of the list:

Exercise 6.18 Add code to your project to create a temperature list for January and print it out.
Exercise 6.19 Print out the warmest day in January.
It is worth looking very carefully at the indices used in the slicing operation. In the slice above, we specified 0 as the lower boundary, and 31 as the upper boundary. When creating slices, the element at the lower boundary is included, while the element at the upper boundary is excluded. In other words: the new list will hold a copy of the elements 0 to 30 from the original list. These are 31 elements. In any slice [n:m], the value of m-n will tell use the number of elements we will receive.
Exercise 6.20 Print out the warmest day in February. Then the warmest day in March.
We can create a slice of a list by providing two indices separated by a colon: list[start:end]. This will create a new list holding the elements from start (inclusive) to end (exclusive). We can leave out the start index (list[:end]) to create a slice starting from the beginning of the list, or leave out the end index (list[start:]) to create a slice that reaches to the end of the list.
When we want to slice the data for later months in the year, determining the beginning and end of the slice becomes quite tedious. Counting or calculating the numbers by hand quickly gets annoying. We will come back to this later in this chapter, where we will implement a solution to deal with this problem.
First, however, let us look at one more list method: sorting.
6.3.4. Sorting: Finding the 10 coldest days
In the next step, we would like to find the 10 coldest temperatures of the year. There is no built-in function to find the 10 most minimal values, so we will have to think of something else.
We could, of course, write a loop and iterate over the list, look at each element, and try to identify the 10 smallest numbers. There is, however, an easier solution.
Part of the solution is the built-in sort() method of the list type. The statement

will sort our list, with the smallest value first and the largest at the end. We can also sort the list in descending order by providing a parameter:

With the knowledge of sorting and slicing, we can now solve our problem: To print out the 10 coldest days, we can sort the list and then take a slice of the first 10 elements.
Exercise 6.21 Print out the temperatures of the 10 coldest days of the year.
Exercise 6.22 Print out the temperatures of the 10 warmest days of the year.
Did you manage to print the 10 coldest days? If you did – very good. There is, however, a potential problem. To discover what it is, do the following exercise.
Exercise 6.23 Run your program again. Make a note of the day number of the hottest day of the year and/or the warmest temperature in January, which your program should still print out.
Then move the code to print the 10 coldest days up in your program, so that this information is printed first, before the other lines of information. Run your program. Inspect the data for the hottest day and the warmest January day and compare them with the values you had noted before. What do you observe?
With the exercise above, you should have noticed a problem: all the computations after printing the 10 coldest days are wrong. This is because the sort function has sorted the list, and we have now lost the order of the original list. We can no longer use it for our calculations, because it no longer in its original order.
The solution to this is to take a copy of the temperature list before sorting it, so that we leave the original list intact:

We can then use the sorted list for the 10 coldest days, while still being able to do further investigations with the original list.
Exercise 6.24 Change the calculations of the 10 coldest days to work with a copy of the original list. Test your program: are the other values shown correct again? Once they are, you can move the printing of the 10 coldest values down in your program again.
The list.sort() method sorts a given list. The list.copy() method creates a copy of a list.
A version of the project with the implementation discussed thus far is in the book projects as temperature-v2.
6.4. Processing lists
So far, all the operations we needed were available in ready-made functions. We used, for example, the min(), max() and sort() operations for our purposes, and it will often be the case that much of what we need is already available in the standard functions provided. Even if the exact function we need is not available, the existing functions often help doing a large part of the work. Assume, for example, that we want to calculate the average (mean) temperature for the year. There is no ready-made average function in Python, but we can quite easily compute the result using the sum() and len() functions. (Strictly speaking, this is only half true: there is an average function available in a standard module that we could import, but let us ignore this for now and work with the sum() and len() functions.)
Exercise 6.25 Calculate and print the average temperature for the year.
Sometimes, however, we have tasks where the pre-made functions do not directly help us. In those cases, we typically have to process the list ourselves. This often involves a loop iterating over the list elements, and one or more variables to compute the result.
We will investigate this first by implementing two of the exising functions ourselves: sum() and max().
6.4.1. Calculating the sum
Let us consider the sum() function first: We can calculate the sum of a list using the following algorithm:
-
Create a variable
totaland initialise it to0 -
Loop over the list; for each element:
-
Add the list element to total
-
Try to write this function yourself.
Exercise 6.26 Implement a function called my_sum() that takes a list as a parameter and returns the sum of its elements (without using the built-in sum() function). Print out the sum of your list of temperatures using your function. Also print out the sum using the built-in sum() function. Compare the results. Are they the same?
6.4.2. Finding the maximum
A similar pattern can be used to find the maximum in a list. Here, however, we have to add an if-statement to our algorithm to solve the problem. The idea looks like this:
-
Create a variable called
maximumand initialise it to the first element of the list. -
Loop over the list; for each element:
-
If the element is larger than
maximum:-
Assign the current element to
maximum
-
-
Exercise 6.27 Implement a function called my_max() that takes a list as a parameter and returns the maximum of its elements. Print out the maximum of your list using your function. Also print out the sum using the built-in max() function. Compare the results. Are they the same?
Exercise 6.28 Why did we initialise the maximum variable to the first list element? Why did we not just initialise it to 0? Would it work the same if we initialised it to 0?
Exercise 6.29 Are there cases where our function would fail?
6.4.3. Finding the biggest change
Next, we would like to answer the question of the biggest swing in temperature: On which day did we see the largest temperature difference from the previous day?
There is no ready-made function available to compute this, so we will have to write a function ourselves. This one is a bit more involved than the previous two we looked at.
Let us start with some observations:
-
To investigate the largest temperature difference, we have compare each day to the previous day.
-
This means that we have to start at the second day; the first day has no previous day.
-
It also means that we need the day index: we can compare a day to the previous day by comparing
temp[n]totemp[n-1]. This only works when we have the index available.
In the previous exercises, we wrote loops over the elements of a list using a for loop like this:
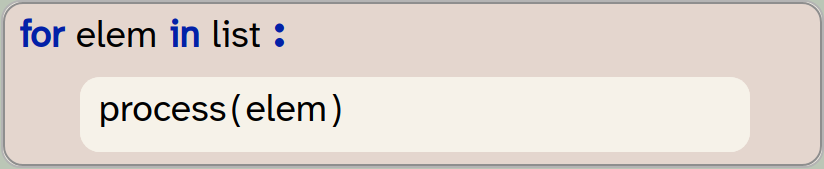
This is fine when we can process every element separately, in isolation, but is not sufficient when we need to compare the element to other neighbouring elements. In that case, we should use the loop with an index:
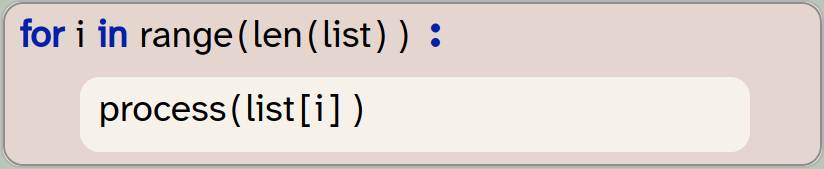
Here, the loop variable does not iterate over the list elements. Instead, the loop variable is an int, and it iterates over all the valid indices of the loop. (Remember: range(n) includes all values 0 .. n-1, and list indices are 0 .. len(list)-1, so range(len(list)) gives us exactly all the valid indices.)
Iterating over the indices of a list (rather than the elements themselves) gives us more flexibility to access several different elements in each iteration.
An advantage with this loop now is that we can also access list elements other than the current one by writing, for example, list[i-1].
If we want to use this pattern for finding the temperature differences, as discussed above, we have to modify it slightly, since we would like to start the loop with the second element. We can achieve this by using the range function with two parameters, for the lower and upper boundaries:
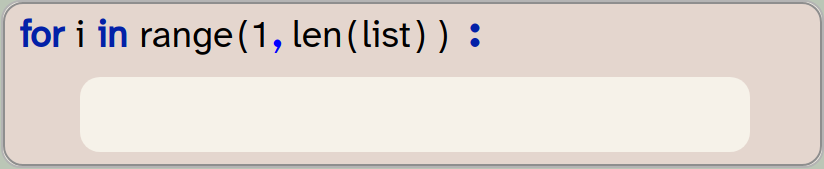
In this variant, the first time the loop body executes, it will access list[1], which is the second element.
Next, we look at how we can tell the difference between the current and previous days. To compute the difference between two values a and b, we can subtract the values from each other and then use the abs(n) function. abs(n) is a built-in function, and it returns the absolute value of n (that is, the positive equivalent, if n was negative). It is necessary to use the absolute value, as the temperature may go up or down, so the value of a-b might be positive or negative.
The built-in abs(n) function return the absolute value of n.
Putting these pieces together, we get a loop that looks like this:
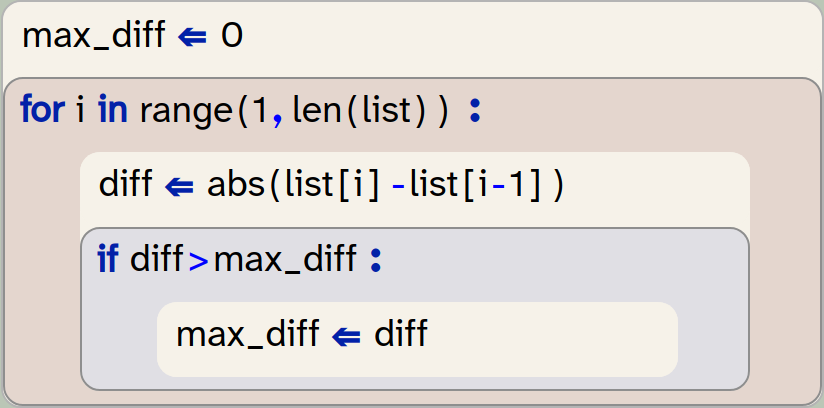
Exercise 6.30 Look at the code above and explain it in your own words. Write down this explanation.
Exercise 6.31 Implement the code above in your own program and print out the biggest temperature change in the year.
Exercise 6.32 If you have not already done so, make sure that the code from the previous exercise is in its own function (perhaps called biggest_change(list)).
Exercise 6.33 Change your code so that it does not find the biggest temperature change, but instead the day number on which the biggest change occurred. Print it out. Which day is it?
Exercise 6.34 Change your function again so that it finds both, the largest temperature change and the day on which it occurred. (Hint: The return statement used in a function can return more than one value: return a, b.)
Names of loop variables: We have previously said that you should always choose meaningful names for variables. Yet in the code above, we have used the name i for the loop variable. This is not an accident: Traditionally, i is often used for a loop variable of type int if it is used as an index. This is so common, that i for an index loop variable is actually a meaningful name – every practiced programmer will understand it. This also means that you should use i as the name only if the variable is a loop variable used as an index.
An implementation of the exercises discussed in this section is in the project temperature-v3.
6.5. Calculations with lists
In the chapter this far, we have deferred two problems for later: the first was translating a day number to a more readable date format. We can print out the day number of a day, but we don’t really know what date this represents.
The second problem was that we had to know the day numbers of the start and end date to specify months for slicing. Again, using a different format for accessing months would be preferable. Let’s start by looking at the second problem.
We start our solution by creating a list that holds the numbers of days for each month. (This is slightly simplified, because we are ignoring leap years. But it works for our data, since 2025 was not a leap year.)

What we actually need, however, is not the length of every month, but a list with the day number of the start of every month. We can create such a list by going through our list of month-lengths and adding up the day numbers. Figure 6.2 illustrates this idea.
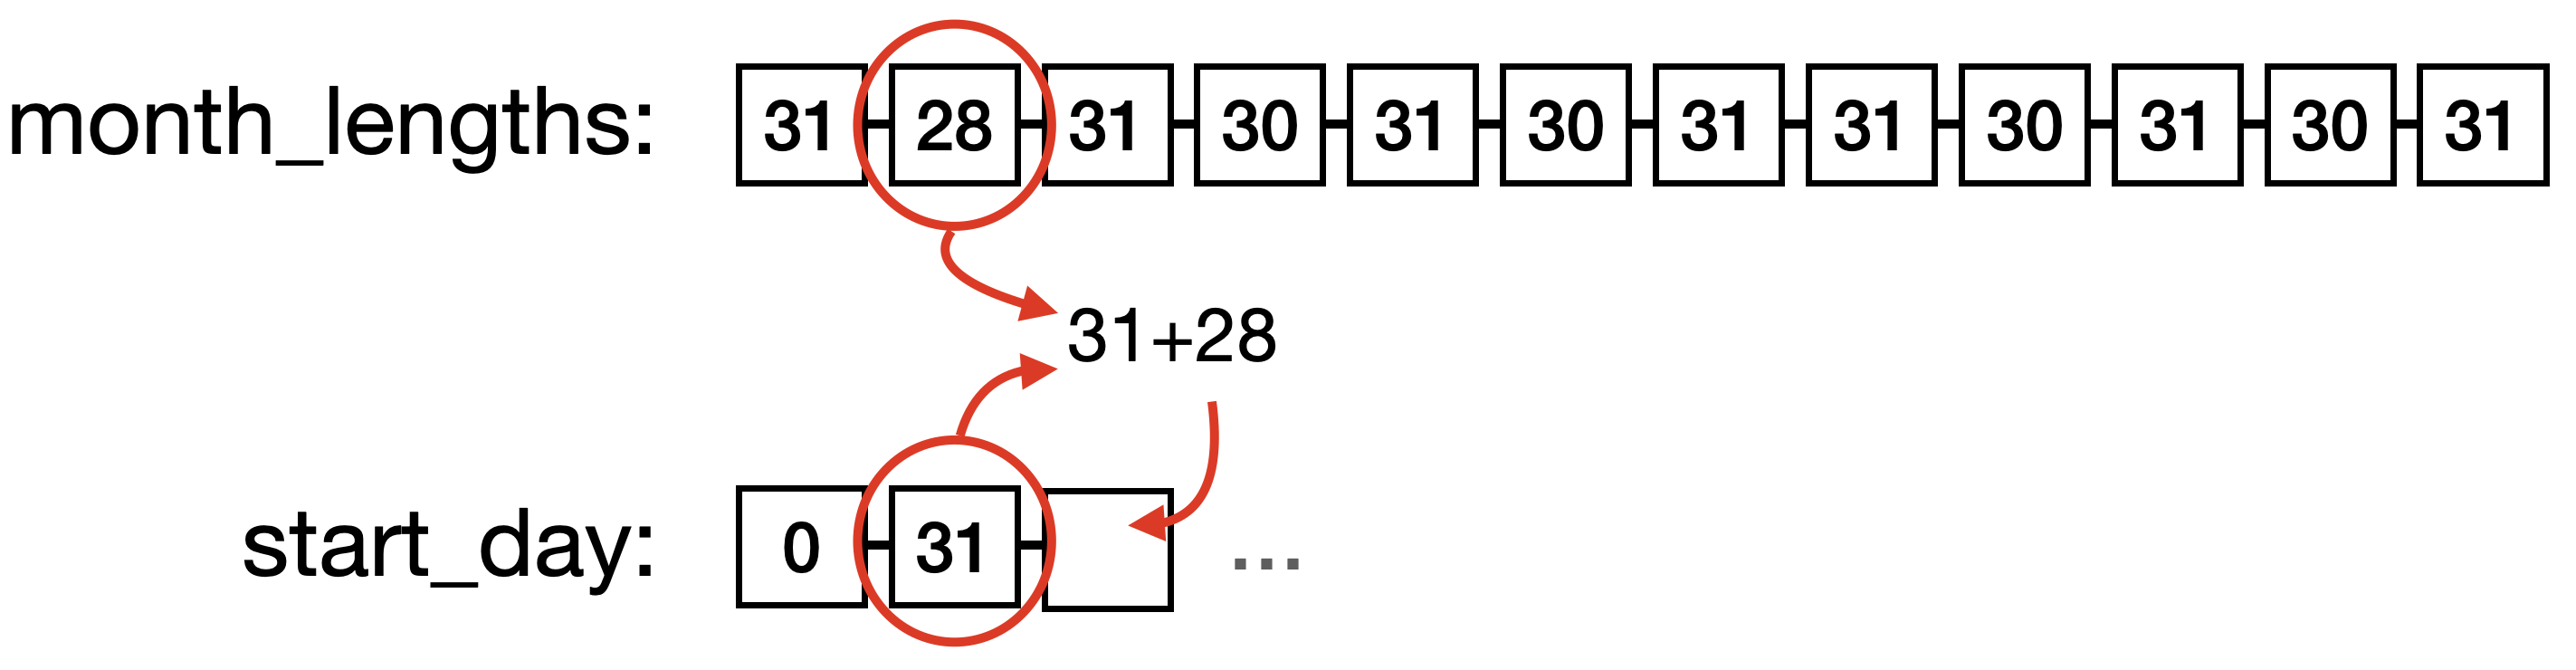
In our new list, start_day[0], for example, is that start of January, start_day[2] is the start of March, and start_day[11] is the start of December.
To create this list, we start with a list that just contains 0 as the start index for January. Then we create the rest of the list by adding the number of days of each month to the last value in our new list, as shown in Figure 6.2. The code to achieve this looks like this:
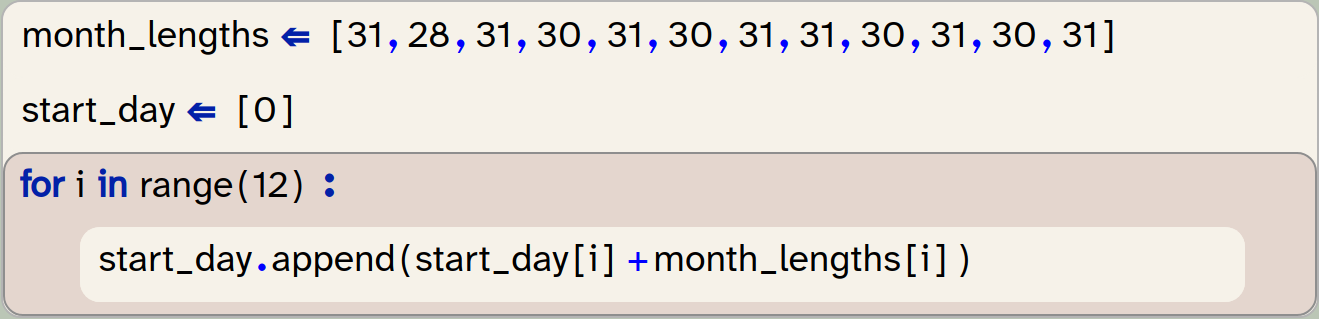
You may have to think carefully about this idea to fully understand it.
Exercise 6.35 Play the algorithm above through using pen and paper. Draw the month_lengths list. Then draw the start_day list as it is at the beginning. Then go step by step through the code above and modify your drawing with every step to show the effect of that code.
Exercise 6.36 Implement the code above in your own program. At the end, print out the start_day list – does it look like you expected?
Exercise 6.37 How long is this list? Do you have an idea why we made it this length?
This list is now very useful for creating slices of data for a specific month. Every entry in this list, together with its next value, now tells us exactly the start and end of the slice for a month. Note that we have created this list with 13 values (not 12), so that December also has a following value to mark its end.
We can now write a function that gives us a slice for a given month:
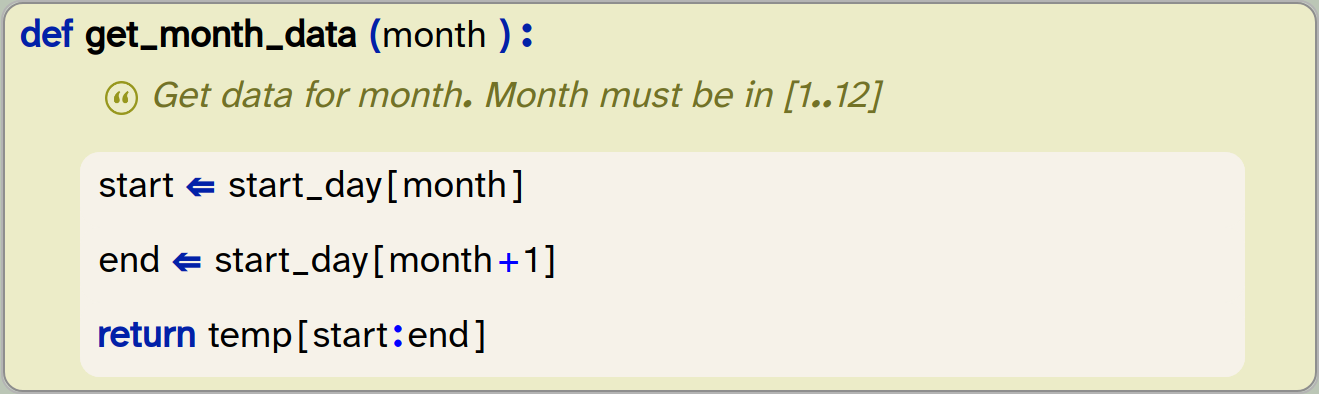
This function can be called with a number for a month, and it will return the sliced list with the temperature values for that month. For example, get_month_data(0) will return the data for January.
Exercise 6.38 Implement the function shown here in your own program. Test it by printing out the values for December. The temperature for the 1st of December should be 10.7 degrees.
Exercise 6.39 Find and print the temperature of the warmest day in December.
Exercise 6.40 One minor annoyance is that the month numbers are out by 1 compared to what we commonly use. For example, we have to write 2 for the March data, but we normally refer to March as 3. Modify your get_month_data function so that we can use normal month numbers (i.e. 1 for January, 12 for December, and so on).
Exercise 6.41 You can now call your get_month_data function with values 1 to 12 as parameters. What happens if you use an invalid parameter, for example 14, or -1? Try it out.
Exercise 6.42 Modify your function so that it prints out an error message if it is called with an invalid parameter and works as before if the parameter is valid.
An implementation of the exercises in this section is in the project temperature-v4.
There are many possible extensions to this project. We could, for example, modify our function to accept names of months, rather than a month number, and then use another list of month names to find the index of a given month by searching for the name. We can also use the same start_day list that we have used here to write a function that maps a day number to a date as a day/month pair. These are somewhat advanced exercises, and we leave it to the curious reader to work on them.
Instead of discussing more possibilities of processing our list of numbers, we will – in the next chapter – look at how we can use lists for other types of data. We will do so by looking at some graphical programs again.
6.6. Summary
In this chapter we had a good look at lists and some of their operations. We worked mostly with a list of numbers – floats, to be precise – and we have seen that we can find specific elements, sort or slice the list, and write loops that process every element.
Many convenient list functions are provided in Python by default, and it will be very useful to become familiar with them. In the next chapter, we will see other situations in which these are very useful.

-
Python provides a list type, which can store a list of items. Lists are defined using square brackets and values separated by commas:
[ 1, 2, 3]. -
We can find out the type of a data item using the built-in
type()function. -
We can access individual elements in a list by providing an index in square brackets, in the form
list[index]. -
Index numbers in lists start with index
0. -
String concatenation joins two strings together into a single string. It is written with a
+sign:string1 + string2. -
Values can be converted from one type to another by using built-in type conversion functions. The most commonly used conversion functions are
int(n),float(n)andstr(n). -
We can create an empty list by writing just a pair of square brackets:
[ ]. -
The list method
append(n)adds an element to the end of the list it is called on. It is called in the formatlist.append(elem). -
The
min(list)andmax(list)functions can be used to find the minimum or maximum value in a list. -
The
list.index(n)method can be used to find the index of the first occurrence of elementnin the list. The element must exist in the list when this is called. -
We can create a slice of a list by providing to indices separated by a colon:
list[start:end]. This will create a new list holding the elements from start (inclusive) to end (exclusive). We can leave out the start index (list[:end]) to create a slice starting from the beginning of the list, or leave out the end index (list[start:]) to create a slice that reaches to the end of the list. -
The
list.sort()method sorts a given list. Thelist.copy()method creates a copy of a list. -
Iterating over the indices of a list (rather than the elements themselves) gives us more flexibility to access several different elements in each iteration.
-
The built-in
abs(n)function return the absolute value ofn.

Graphical plotting
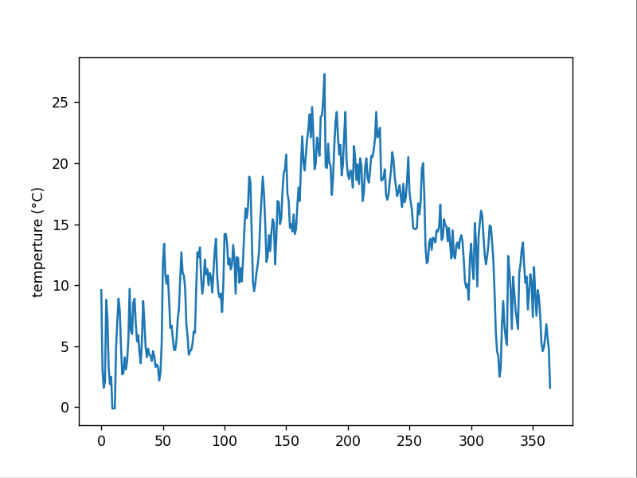 One thing we have not yet done with our temperature data (but which is quite an obvious idea) is to plot the data as a graph.
Here is a project that does just that: temperature-plot.
This project uses the same temperature data we have used in this chapter, and then turns it into a graph. Plotting the data graphically is easier than you might expect, as there are good libraries available that do all the hard work for you. In this case, we use the library matplotlib.pyplot, which does the work for us.
If you want to do more with this, have a look at the pyplot documentation here (or search the web for "Pyplot tutorial" if you are reading this on paper). You will see that you can generate sophisticated graphs quite easily.
Kaggle
 In this chapter, we have started to analyse some data, and we have used a London temperature dataset for this. Of course, you can analyse all sorts of other data.
A good source to find interesting data files is Kaggle. It is a website where people share all sorts of interesting data, and you can usually find something that interests you. The available data is very wide-ranging, from most-streamed songs on Spotify, via mental health data, sports statistics, transport data, environmental data to crime data, and much more inbetween.
Have a look, pick something that interests you, and start to analyse.