Chapter 12. Additional project ideas
In this chapter, we will not discuss any more new material, but instead present a few project ideas. Some of the Strype project provided are functional – they do something reasonable – while others are barely started. All can be extended.
The purpose is to give you some ideas what else you could do, to provide some inspiration, and to give you some sample code to study and learn from. Look at them, run them, and take them wherever your imagination takes you.
12.1. Visual effect: Explosion
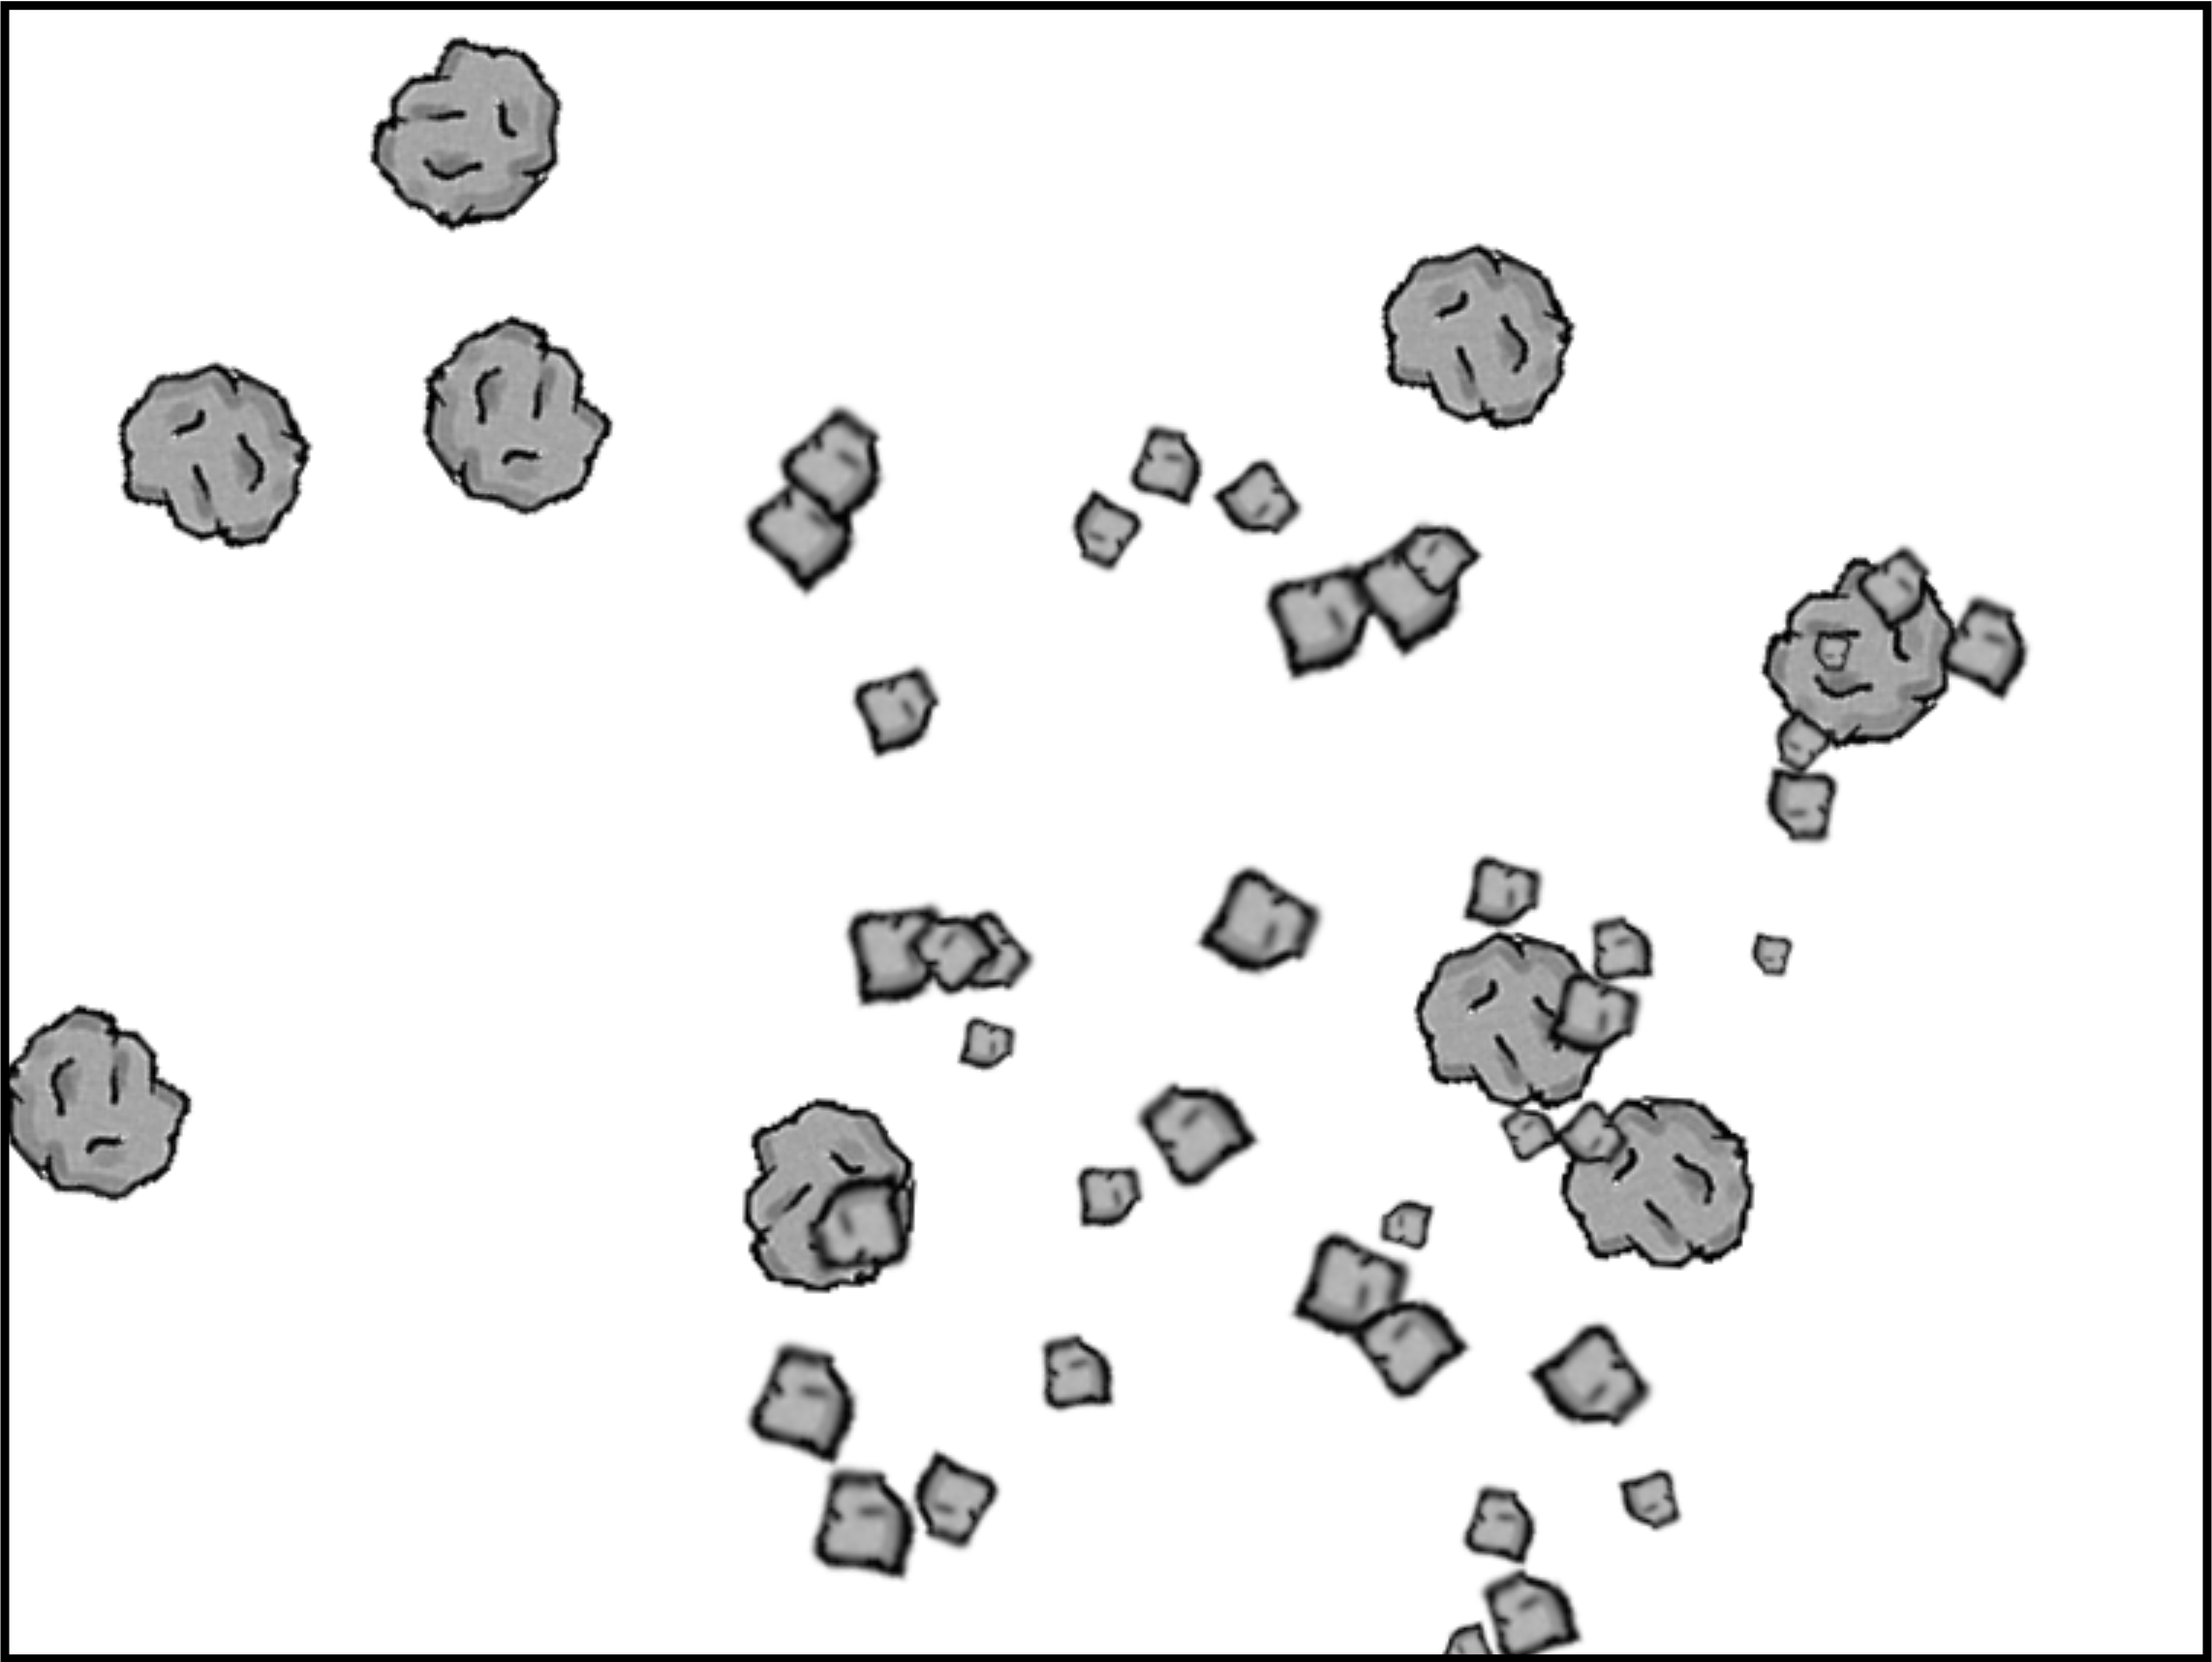
This project does not implement any stand-alone functionality, but a visual effect: an explosion.
It starts off with some rocks. Press a key on the keyboard to set off an explosion, and sit back and watch.
The explosion is implemented by replacing a rock on screen with 40 smaller parts of rock fragments (of random size), and giving each of these fragments a random initial speed and direction of movement. The inherent movement speed is stored as a dx/dy value pair – the distance with which the fragment will travel in the horizontal and vertical direction at each step.
We can then easily apply gravity: At each animation step, we change the vertical movement speed (dy) by subtracting a gravity constant. This will make dy a larger and larger negative number, increasing the speed downwards at each step.
12.2. Flocking behaviour: School of fish
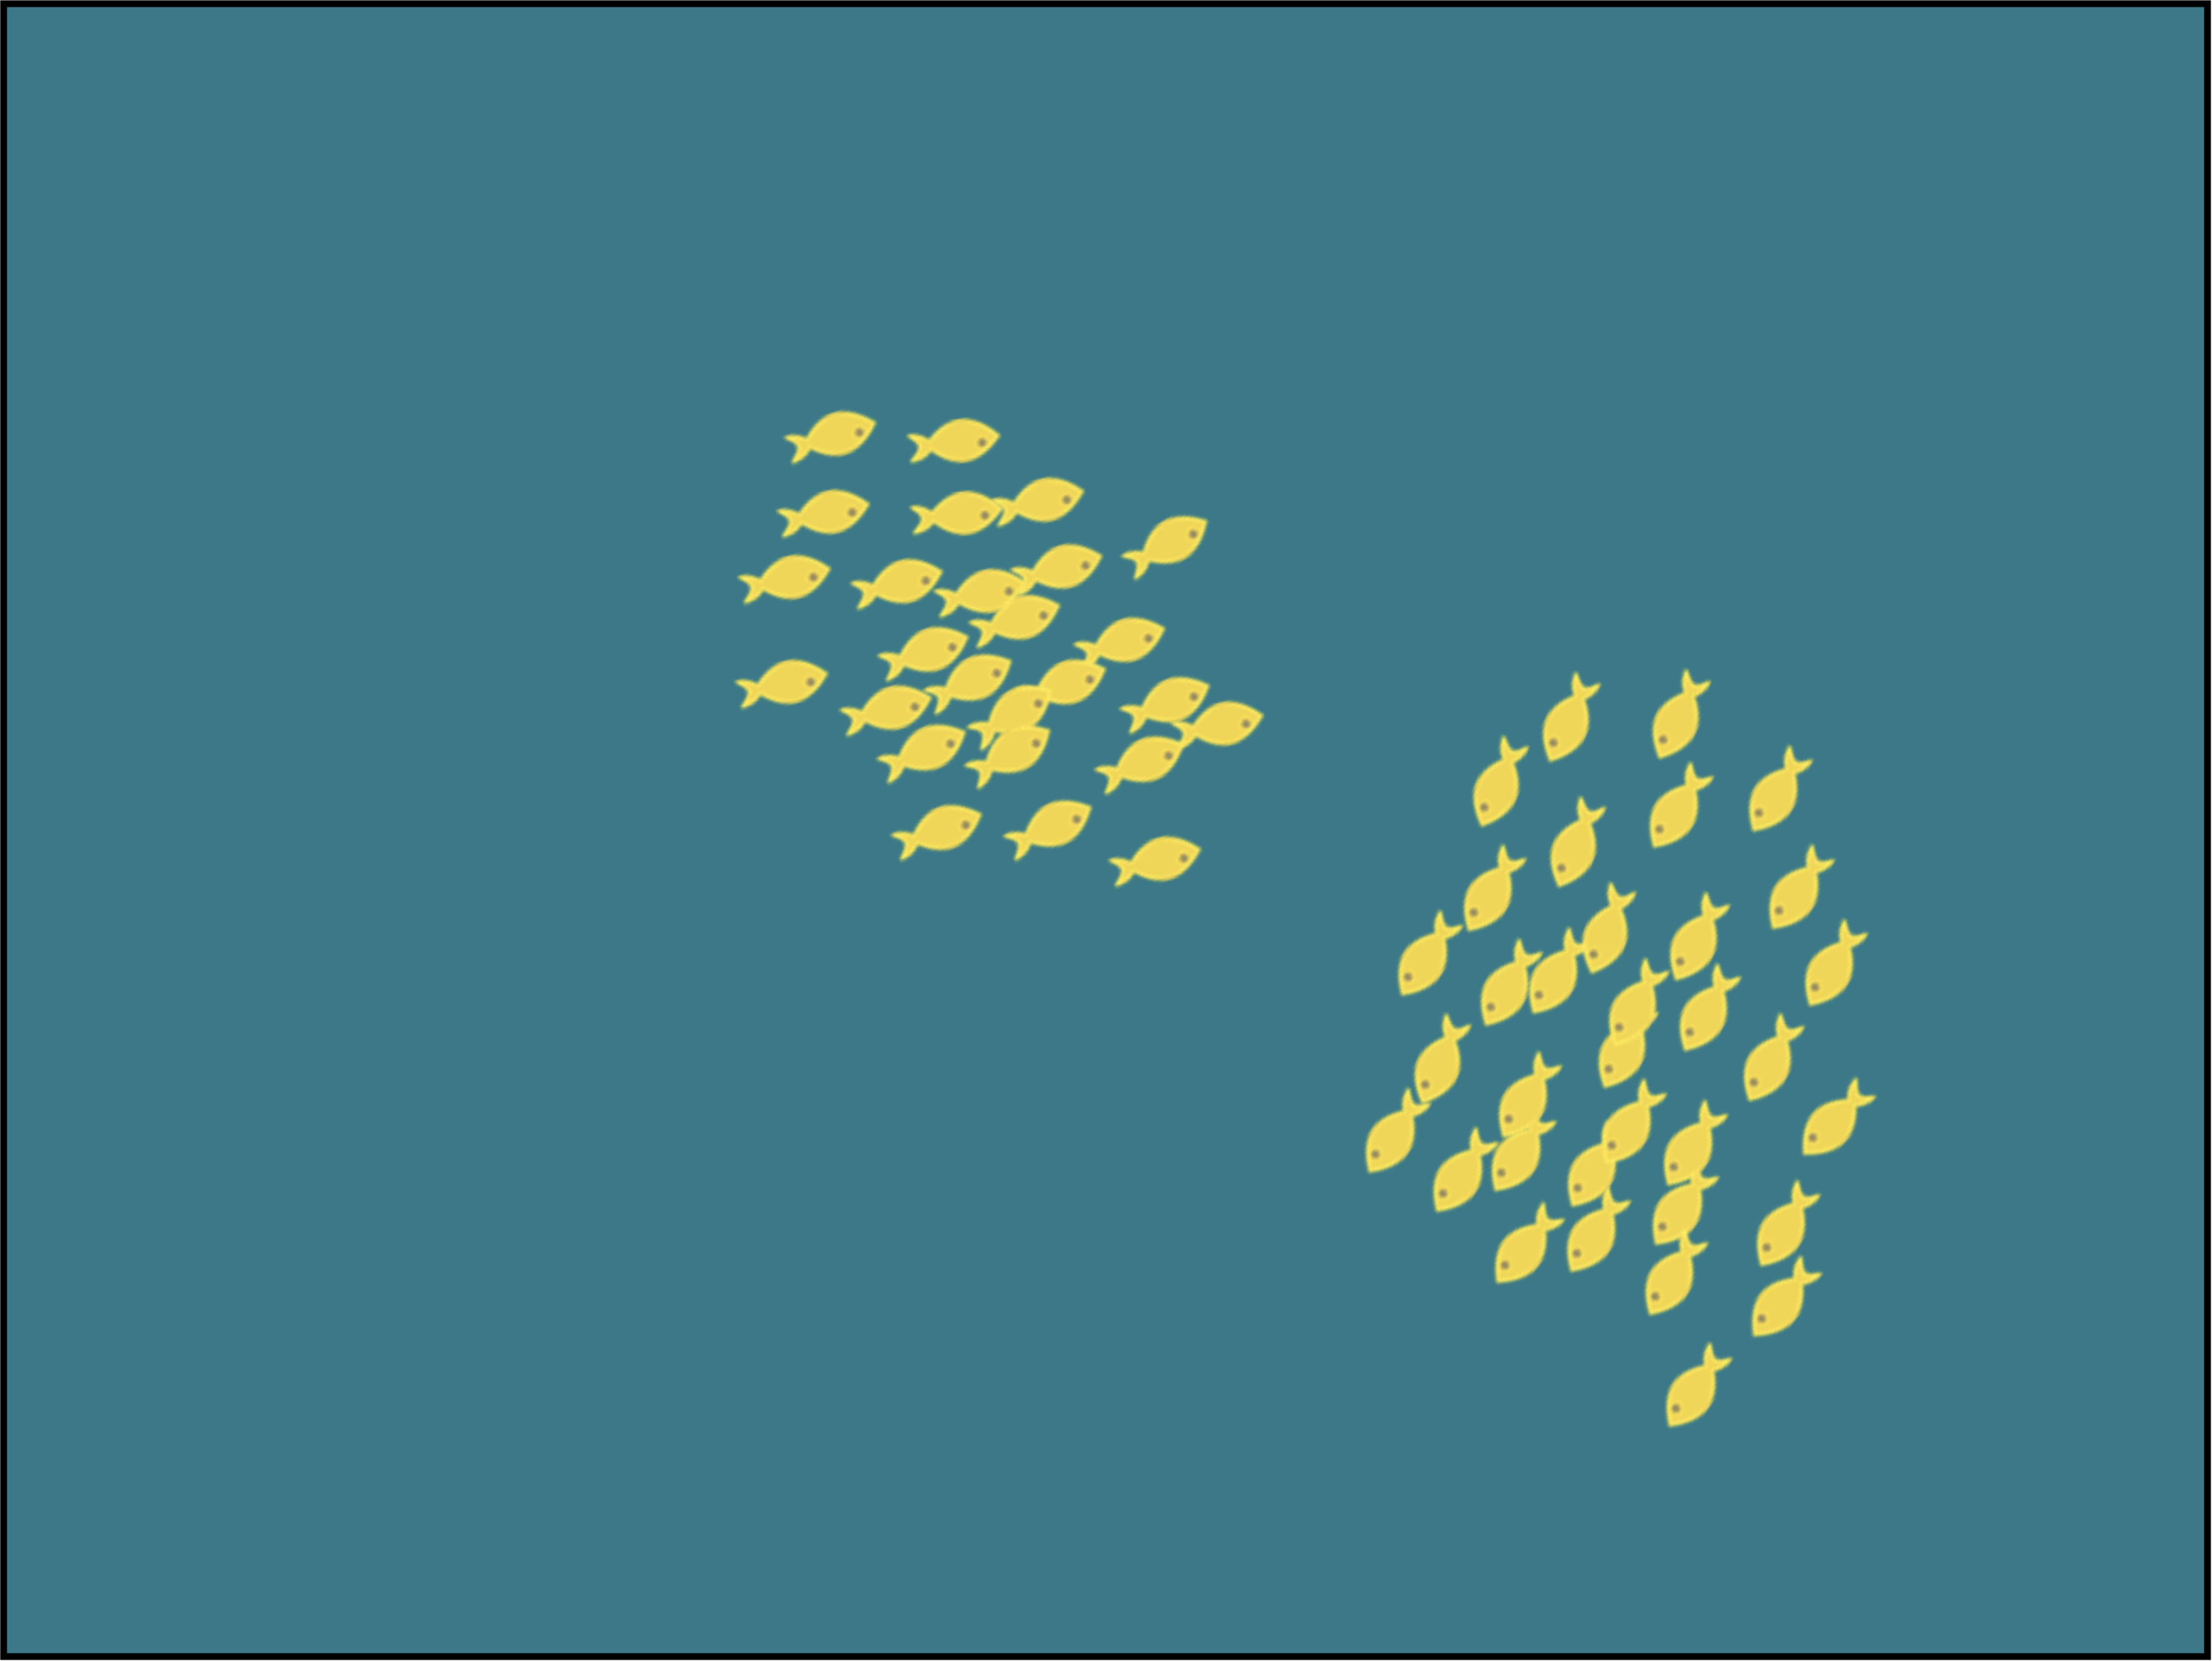
This project implements flocking behaviour.
Flocking is a natural animal behaviour exhibited by various groups of animals. The name flocking is taken from flocks of birds (such as starlings) which are famous for this phenomenon. With schools of fish, it is called "shoaling". Swarms of insects or herds of land animals can also show this behaviour.
In a flock, each individual’s motion is influenced by several factors: the desire to stay near to others, the intent to travel in the same direction as everyone else, and goal not to bump into each other, and so on.
If you are interested, do a web search to find out more.
12.3. Object-oriented programming: Little Crab
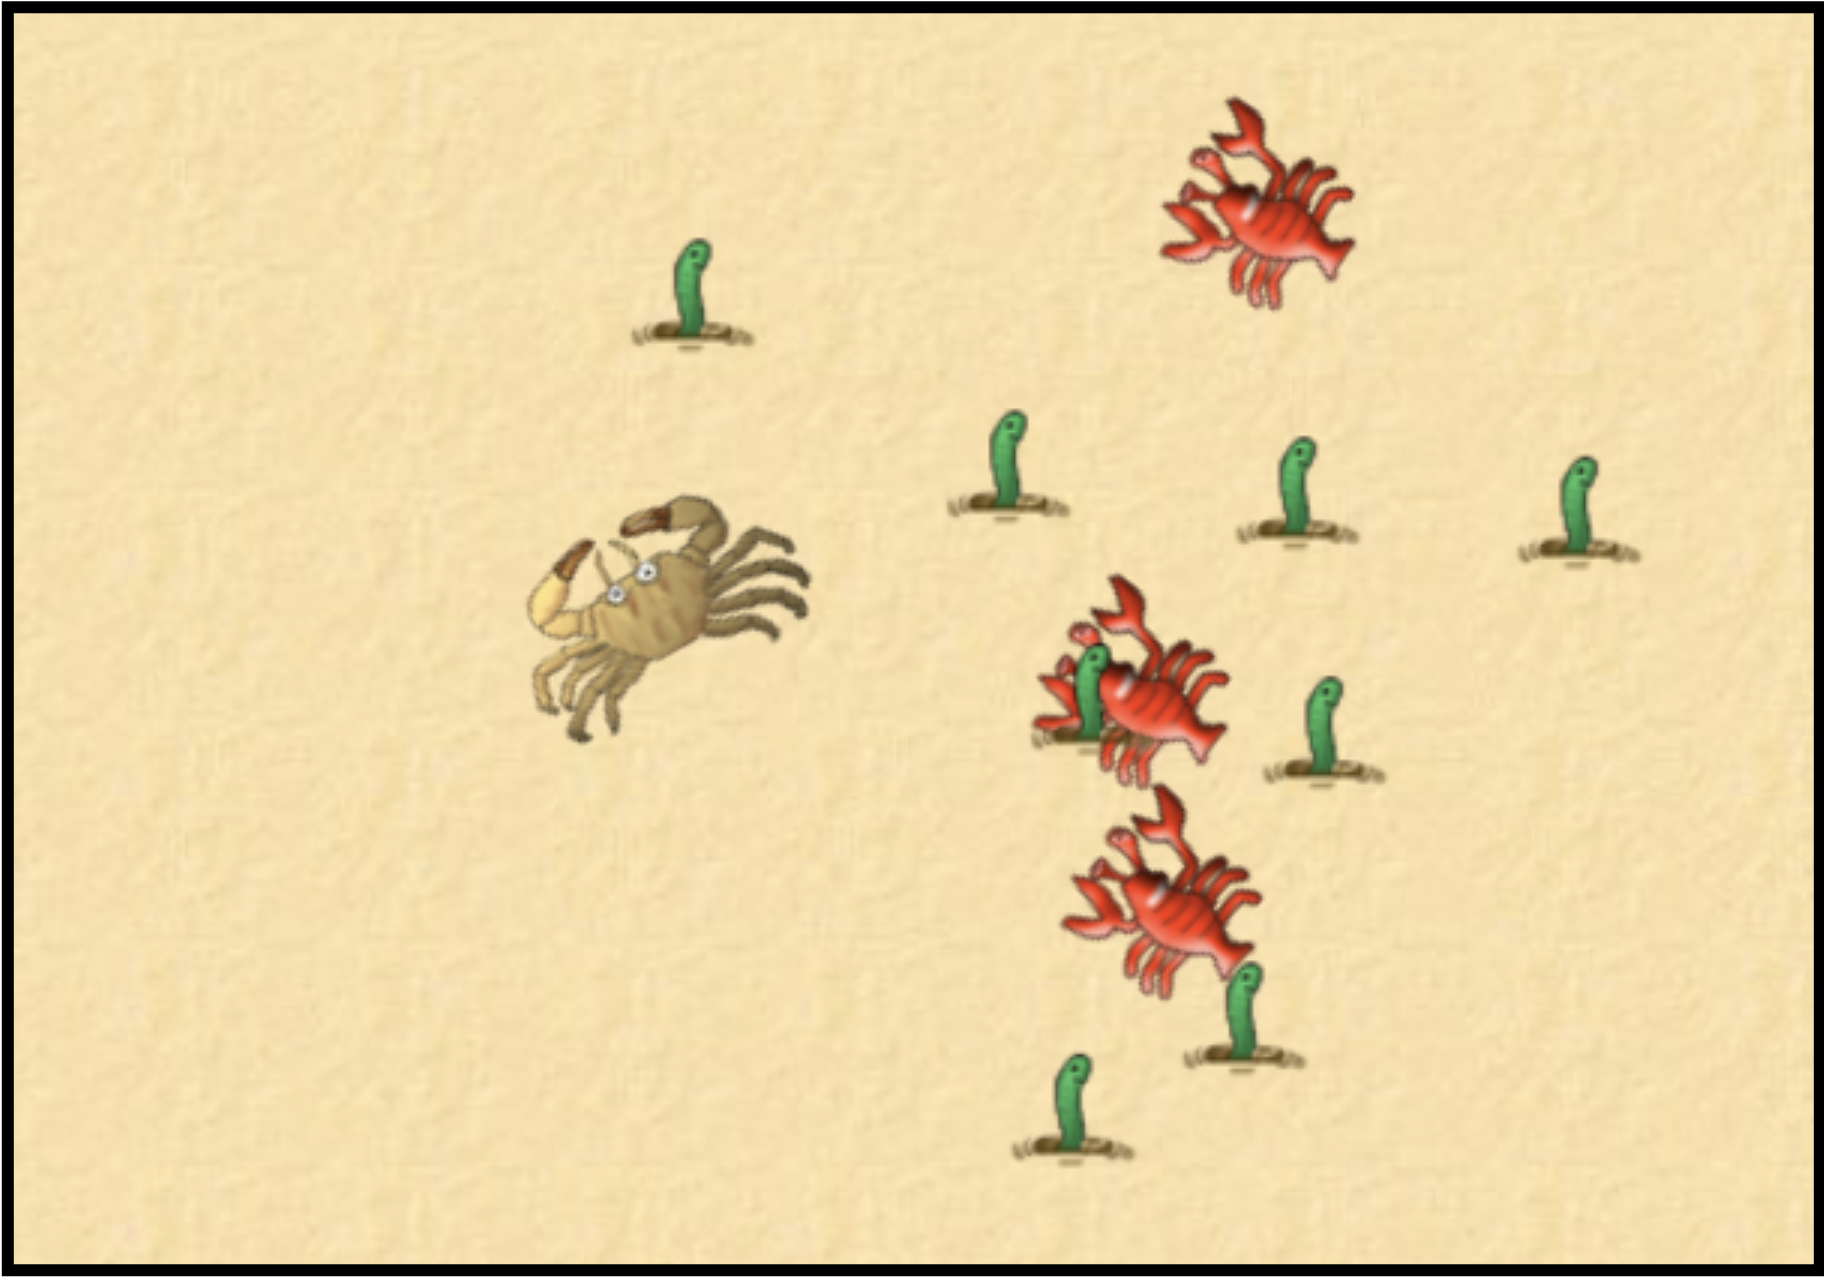
This is an implementation of an old game, first written for the Greenfoot environment in Java, and here translated to Python.
It is essentially the same game as the Yellow-Fish project, which we discussed in the first chapters of this book. The main difference (apart from the use of different images) is that this version was implemented using classes and objects.
It serves here as an example of object-oriented programming. In a way, using objects results in cleaner, more structured code, that can be easier to understand and maintain. If you would like to study object-orientation in Python, have a close look here.
12.4. Sophisticated motion: Cheese
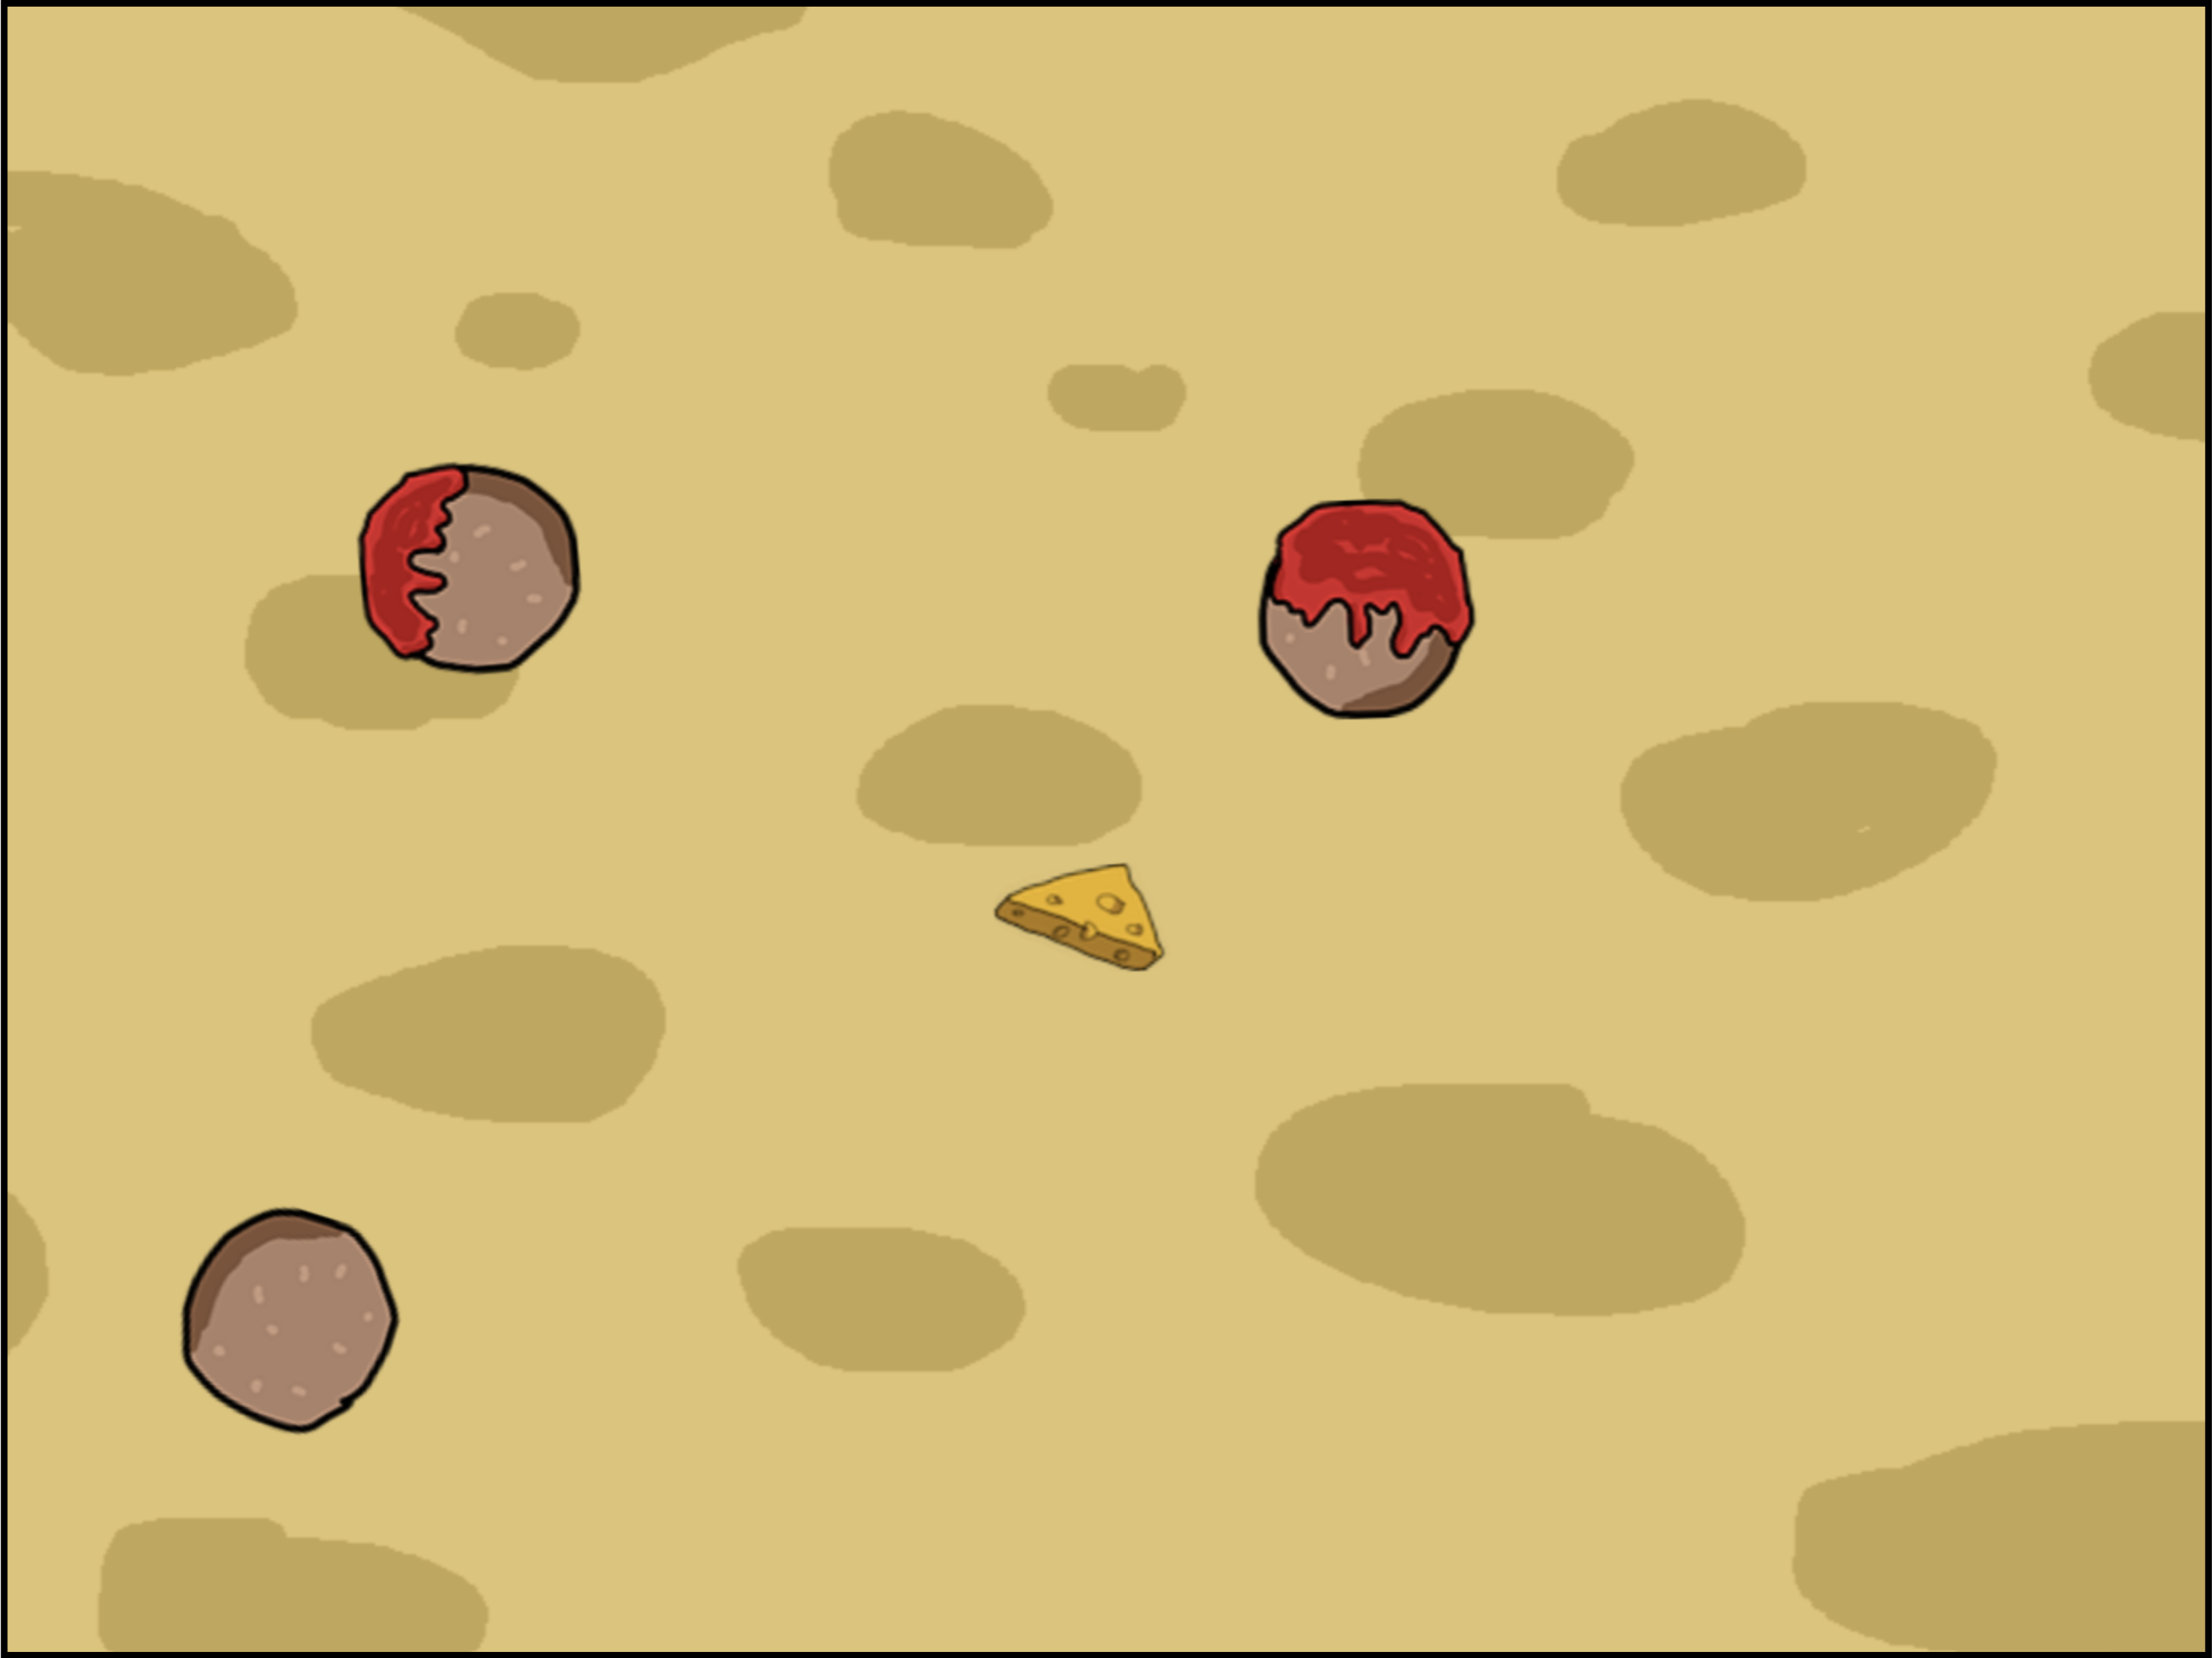
"Cheese" is a fully implemented, playable game. You fly your wedge of cheese through the game, shooting blobs of ketchup at meatballs.
This is quite a sophisticated program, implemented using classes and objects, including a reusable Vector class. Various constants allow you to make the game easier or harder, such as the number of meatballs, the speed of the cheese, or the rate of firing.
The game is based on the classic arcade game "asteroids" (do a web search!), and there is also an asteroid-themed version of the game available here.
12.5. Data analysis: Renewables
If you would like to investigate data analysis (and data science in general) a bit more, then you will eventually move on from writing your own loops to sift through the data, and instead use custom-made libraries that make this functionality easier and more convenient to access. The main libraries that Python provides for this kind of project are pandas, numpy and matlibplot (which includes pyplot).
You may have seen a first example of pyplot in the temperature-plot project at the end of Chapter 6, and an example of the use of pandas to read and analyse csv files at the end of Chapter 8 (in the top-10-songs project).
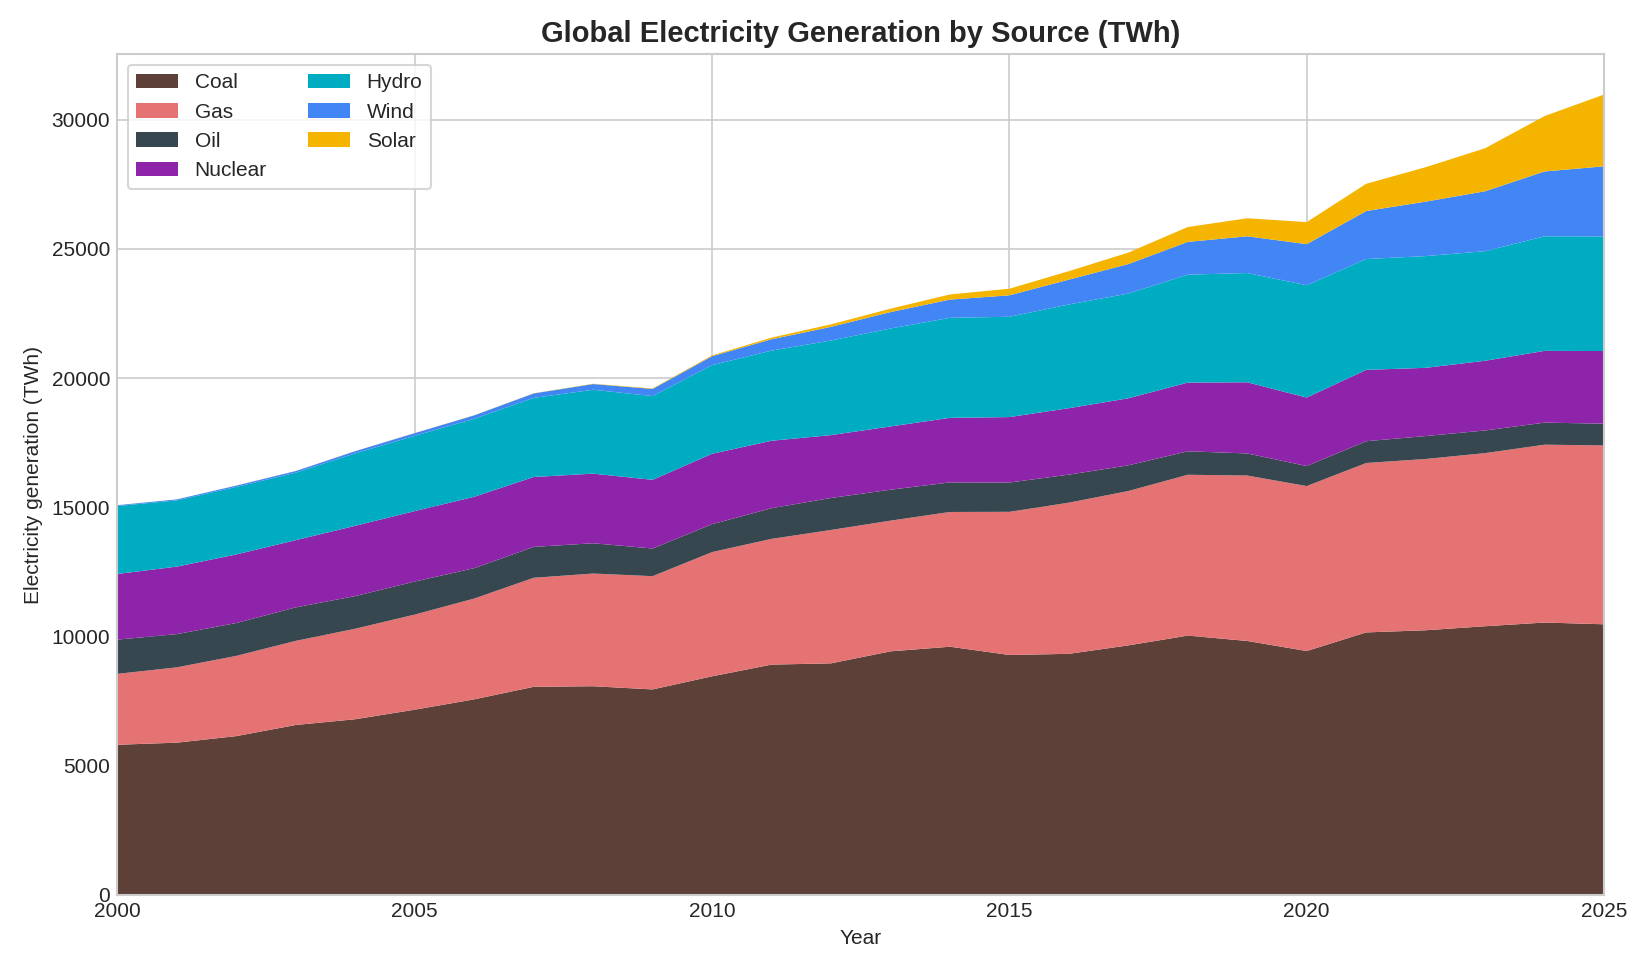
Here is a new project that combines use of pandas, numpy and pyplot to do a bit more sophisticated analysis. It reads in a csv file with detailed data about renewable energy creation (and example of a datset provided on kaggle.com) and produces several graphs of different types. It can also save images of those graphs as PNG image files.
The project is called renewables; to make the writing of image files work, you need to store it in a could file system where you have write access. (You can copy both renewables.spy file and the data file to your own file store.)